
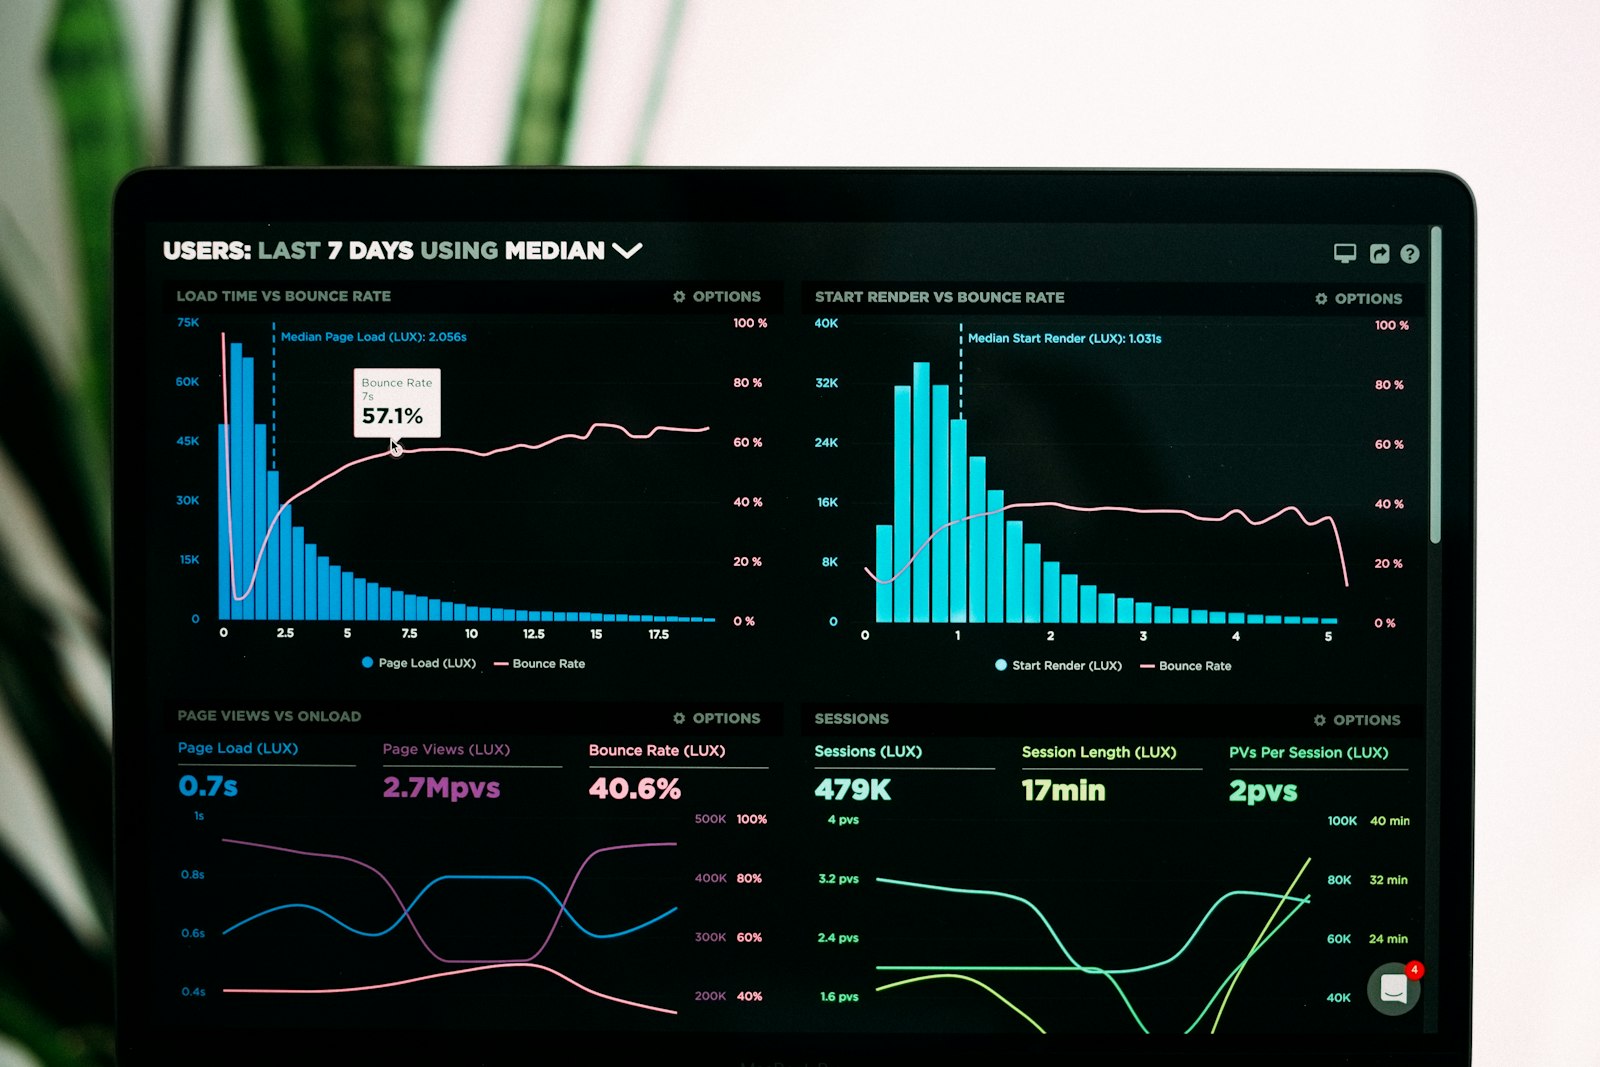
Many companies invest in analytics tools and still make decisions from gut feel or stale spreadsheets. The gap is rarely “not enough charts.” It is that dashboards are not designed for how leadership actually decides.
InsideTech Softwares builds analytic solutions alongside custom software and cloud systems. This article shares what makes dashboards useful for executives and operators—not just visually impressive.

Leadership does not need more metrics; it needs decision support
A useful dashboard answers a small set of recurring questions:
- Are we on track against the goals that matter this quarter?
- Where is performance breaking, and how severe is it?
- What changed recently, and what should we do next?
If a dashboard cannot support those questions in a few minutes, it will be ignored—regardless of how many widgets it contains.
Start from decisions, then choose metrics
Interview stakeholders for decisions, not vanity KPIs. Examples:
- Should we hire more support capacity this month?
- Which product line deserves more engineering investment?
- Are enterprise deals stalling in a specific stage?
- Is cloud/AI spend growing faster than usage value?
Each decision implies a metric set, a comparison (target, prior period, segment), and an owner.
Design principles for dashboards people trust
1. One job per view
Separate executive summary views from deep operational diagnostics. Mixing both creates noise and slows interpretation.
2. Definitions must be explicit
“Active user,” “qualified lead,” and “gross margin” need documented definitions. Ambiguous metrics destroy trust faster than missing charts.
3. Show context, not only snapshots
Trends, targets, and segment breakdowns turn a number into a story. A single green KPI without context invites false confidence.
4. Make data freshness visible
Leaders should see when data was last updated and what timezone or filter is applied. Silent staleness is a common reason dashboards get abandoned.
5. Prioritize action paths
Where possible, link from a metric to the operational queue, CRM view, or runbook. Insight without a next step has limited value.
Data foundations beat chart polish
Pretty visualization on unreliable pipelines is theater. Before investing in visual design, ensure:
- Source systems of record are identified
- Transformation logic is versioned and testable
- Access controls match role needs
- Quality checks catch broken pipelines early
Analytics engineering quality is part of product quality.
Common dashboard failure modes
- Metric sprawl — dozens of KPIs, no hierarchy
- Vanity metrics — activity without outcomes
- No owners — charts nobody is accountable for improving
- Conflicting numbers — different tools, different definitions
- Over-customization — every manager gets a private reality
A smaller shared scorecard plus controlled drill-downs usually outperforms a forest of personal dashboards.
What “good” looks like for different roles
- Executive — 5–9 outcome metrics, trend, variance to plan, top risks
- Operations — queues, SLA breaches, throughput, bottlenecks
- Product — activation, retention, feature adoption, friction points
- Finance / FinOps — unit economics, cloud/AI cost vs usage
Role-specific views should still reconcile to the same core definitions.
Building iteratively
Do not wait for a perfect data warehouse to deliver value. A practical sequence:
- Define the top decisions and metric dictionary
- Ship a thin reliable scorecard from the best available sources
- Instrument product/events where gaps block decisions
- Harden pipelines and expand drill-downs
- Review monthly whether metrics still match strategy
Retire metrics that no longer drive action.
AI and analytics: useful assistants, not autopilot
AI can help with anomaly narration, natural-language queries, and summarization. It does not replace metric governance. If definitions are messy, AI will confidently summarize the mess.
Use AI to accelerate interpretation after the foundation is trustworthy.
How InsideTech Softwares approaches analytic solutions
We typically combine product understanding with data modeling and usable interfaces—so dashboards connect to real workflows in custom software systems. The goal is leadership clarity: fewer debates about whose number is right, more focus on what to do next.
If your current dashboards are unused, the fix is usually not “add more charts.” It is to reconnect metrics to decisions, clean definitions, and design for the way your leaders actually run the business.
Governance that keeps dashboards honest
Create a lightweight metric council—even if it is only three people from product, operations, and finance. Their job is to approve metric definitions, resolve conflicts between tools, and retire unused dashboards. Without governance, every team invents a private version of truth.
Store the metric dictionary where people can find it. Include calculation logic, source tables/events, known limitations, and the decision each metric supports. When someone asks “why doesn’t this match the CRM?”, the dictionary should make the answer fast.
Review dashboards on a fixed cadence. If a chart has not influenced a decision in two months, archive it. Attention is limited; analytics products should respect that. InsideTech Softwares builds analytic solutions with this governance mindset so leadership gets clarity instead of chart fatigue.
From dashboard to operating rhythm
The best analytics programs attach metrics to meetings and rituals: a weekly operations review, a monthly executive scorecard, and an incident retrospective that checks whether leading indicators warned early enough. Without an operating rhythm, even excellent dashboards become wallpaper.
Train managers on how to read variance and ask better questions. Tools do not create analytical culture by themselves. When leaders model curiosity and follow-through, dashboards become part of how the company runs.